
The shortage of lots that has been hindering the housing recovery eased somewhat in 2019, but remains elevated by historical standards, according to a recent survey conducted by the National Association of Home Builders (NAHB). The survey consisted of a set of special questions included on the instrument for the September 2019 NAHB/Wells Fargo Housing Market Index (HMI).
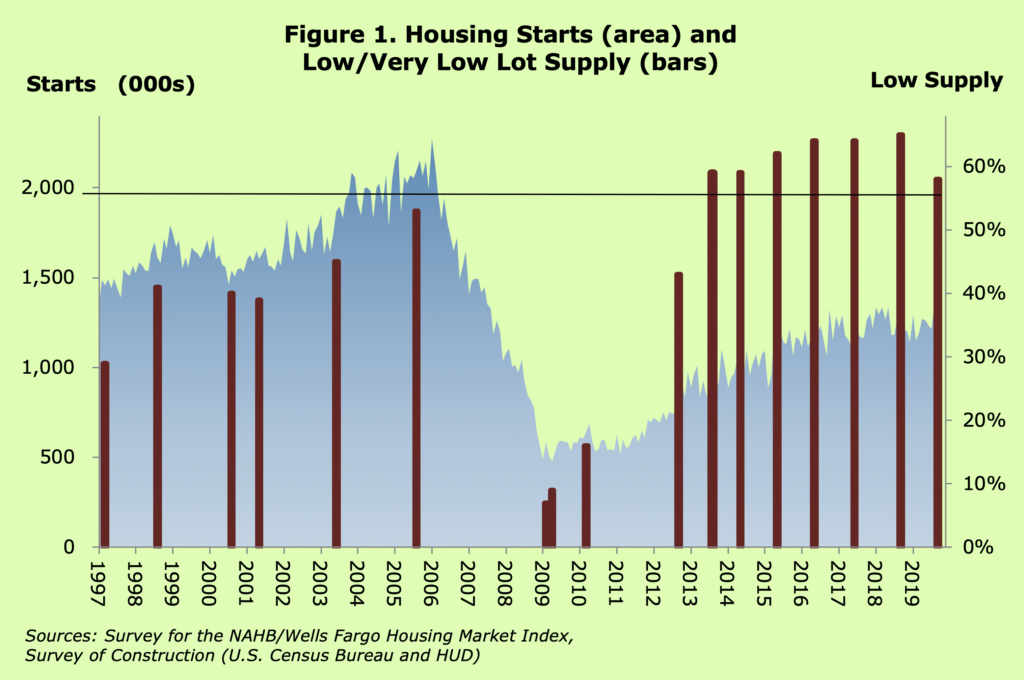
The survey asked a panel of single-family builders, stratified by number of homes started and region of the country, to categorize the supply of lots in their market areas as “very high,” “high,” “normal,” “low,” or “very low,” as well as giving them an option to say they didn’t know or were not sure. In response, 58 percent of builders said the supply of lots was low (40 percent) or very low (18 percent). This is down somewhat from the all-time peak of 65 percent in September of 2018, but higher than it had been at any time prior to 2013 (NAHB has been asking the same lot supply questions on its HMI survey periodically since 1997).
For comparison, even during the boom period in August of 2005, the share of builders characterizing lot supply as low or very low was 53 percent — 5 percentage points below the latest number (fig. 1). The lot supply problem is particularly severe in relation to housing starts, which still have only partially recovered from the last downturn. After averaging 1.5 million from 1960-2007 and hitting a peak of 2 million in 2005, starts have recovered only to about 1.2 million a year.
Although the terms have no precise definitions, builders routinely categorize lots as “A,” “B” or “C,” based on the general desirability of their locations. Not surprisingly, in September of 2019, the lot shortages tended to be especially acute in the most desirable, or “A”, locations. Sixty-seven percent of builders said that the supply of “A” lots was low or very low, compared to 57 percent for “B” and 46 percent for “C” lots. A shortage of buildable lots, especially in the most desirable locations, tends to increase lot prices. Some evidence for increasing lot prices is available in the data from the Survey of Construction (SOC), conducted by the U.S. Census Bureau with partial funding from the Department of Housing and Urban Development. Over the past couple of years, NAHB’s analysis of the publicly available SOC data files has shown that the median value of lots for single-family homes built for sale is rising faster than inflation, and this was true again in the latest data file for homes started in 2018. Compared to Consumer Price Index inflation of 2.4 percent, the median lot price increased by 4.4 percent, reaching a new record high of $49,500 in 2018 (fig. 2).
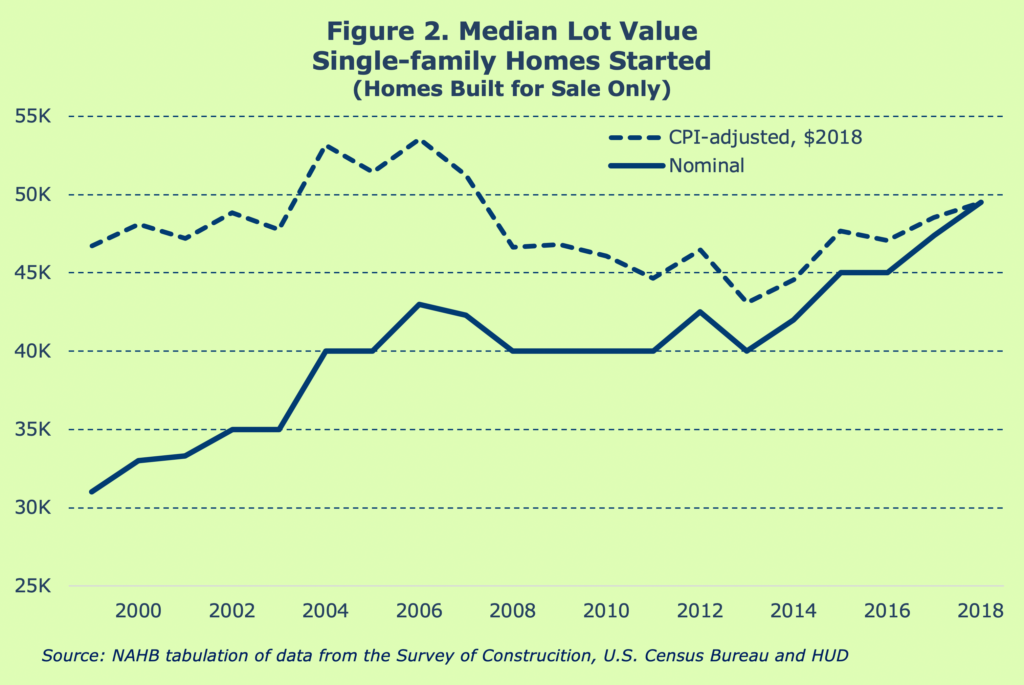
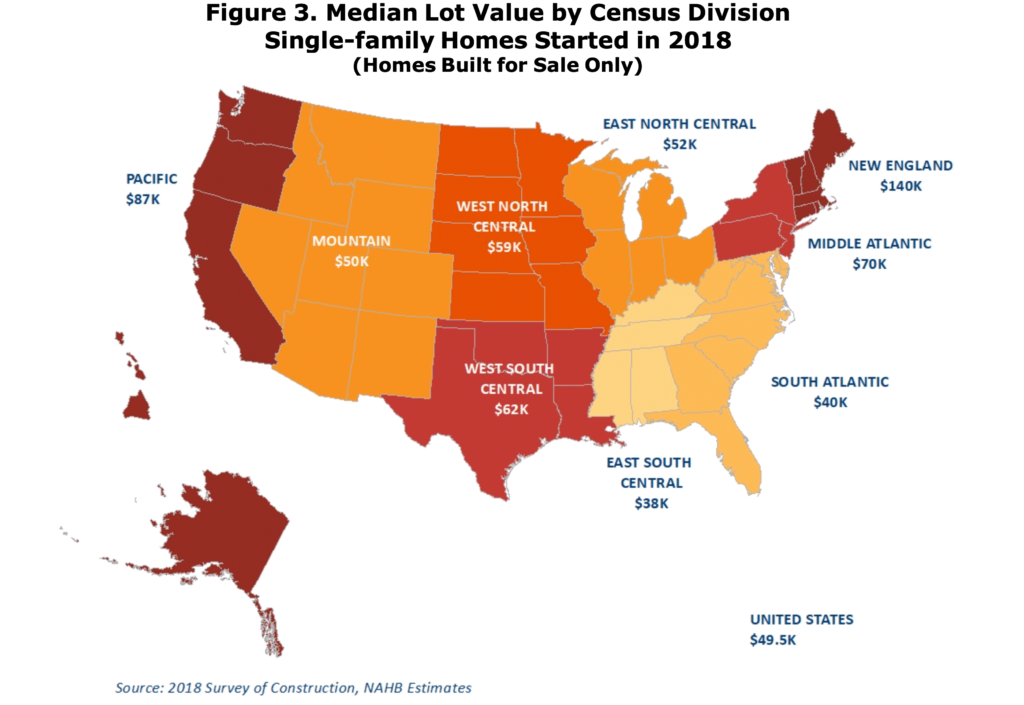
The median lot prices in Figure 2 are based on single-family homes built for sale—that is, homes sold before they are started or intended for sale, usually as part of a tract or subdivision—as opposed to custom homes built one at a time on the land owned by the eventual home owner. The SOC data provide lot prices only if the homes are built for sale. The data also provide enough information to break down these lot prices by the nine Census Divisions. The median lot price for single-family homes built for sale and started in 2018 ranged from a low of $38,000 in the East South Central to a high of $140,000 in New England (fig. 3).
While the $49,500 median lot price for the nation as a whole in 2018 is an all-time high, this is not true if adjusted for inflation. During the boom period, the median lot price reached $43,000, which would be more than $53,000 if converted to 2018 dollars. However, in the West South Central (the division that includes Texas, Oklahoma, Arkansas and Louisiana), the median lot value more than doubled since the boom and in 2018 hit an all-time high not only in nominal terms, but also when adjusted for inflation.
Historically, the median lot value in the West South Central division was the lowest in the nation. However, it started rising disproportionately in 2013 and by 2015 had caught up to the national median. As of 2018, median lot value in the West South Central was 25 percent above the median for the nation.
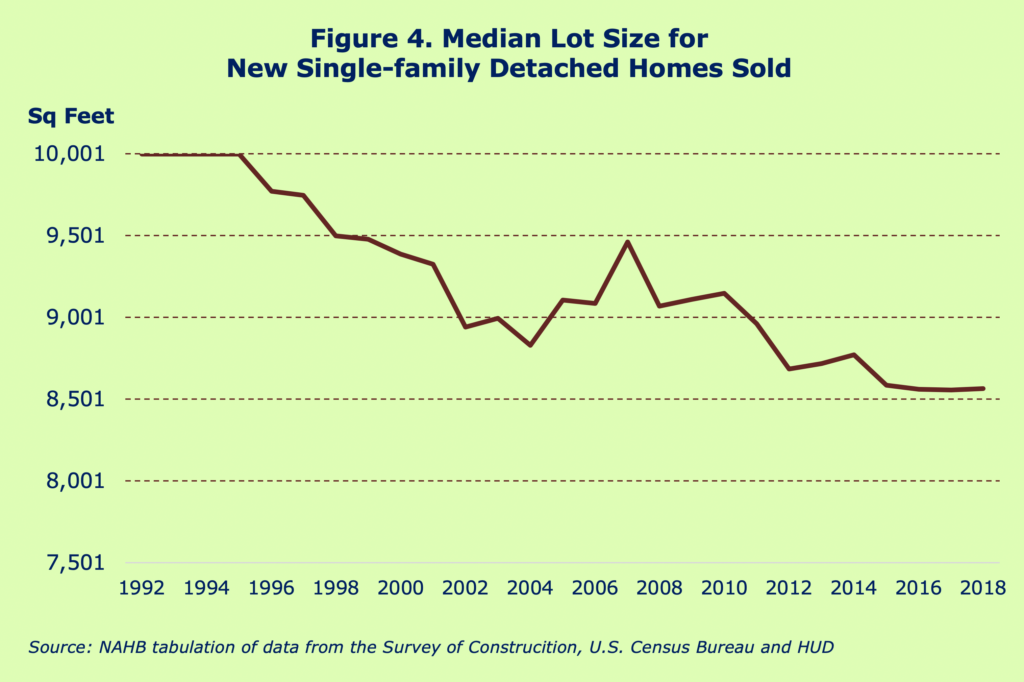
The SOC data also indicate that the ongoing shortage of lots is affecting not only their price, but their size as well. In 2015, the median lot size fell under 8,600 square feet for the first time since the SOC started tracking the statistic, and remained in this record low territory ever since (fig. 4) The median lot size of a new single-family detached home sold in 2018 was 8,567 square feet, or just under one-fifth of an acre. This is just 7 square feet larger but statistically not different from the 2017 median.
The tendency toward smaller lots shows up not only in the median, but also at the extremes of the distribution. A decade ago, 28 percent of single-family detached homes sold were sitting on lots under 0.16 acres; 19 percent were on lots between 0.16 and 0.25 acres. In 2018, these shares increased to 32 and 27 percent, respectively. At the other end of the scale, the share of homes built on lots of more than half an acre declined from 14 percent in 2008 to 10 percent in 2018.