Recent NAHB research verifies what builders around the country have observed: Government regulation and a shortage of lots have retarded the recovery of single-family production following the historic downturn that began in 2007. Most builders and developers are only too well aware of this, having experienced it firsthand, but still may find the research useful in helping explain what’s going on to those less familiar with the industry.
Much of the NAHB research is based on special questions added to the monthly survey for the NAHB/Wells Fargo Housing Market Index (HMI). In May of 2016, 64 percent of builders responding to the HMI survey reported that the supply of lots in the markets where they build was low or very low—the highest the low-supply percentage has been since NAHB began asking the question in 1997. In addition, this record incidence of lot shortages was recorded at a time when new homes were being started at a rate of under 1.2 million a year. By comparison, 53 percent of builders were reporting lot shortages in 2005, when total housing starts were over 2.0 million (Figure 1).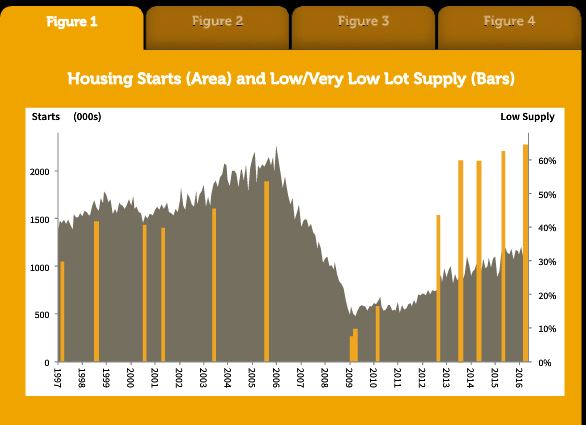
The current high incidence of builder-reported lot shortages is consistent with NAHB’s tabulation of data from the 2015 Survey of Construction (conducted by the U.S. Census Bureau with partial findings from HUD), showing that the median value of lots for new homes started is at a record high ($45,000), while the median size of the lots is at a record low (under one-fifth of an acre).
Some of the problems with land may be due to regulation, according to another recent NAHB study, “Government Regulation in the Price of a New Home.” The study shows that, on average, regulations account for 24.3 percent of the final price of a new single-family home built for sale. Three-fifths of this—14.6 percent of the final house price—is due to a higher price for a finished lot resulting from regulations imposed during the lot’s development. The other two-fifths—9.7 percent of the house price—is the result of costs incurred by the builder after purchasing the finished lot (Figure 2).
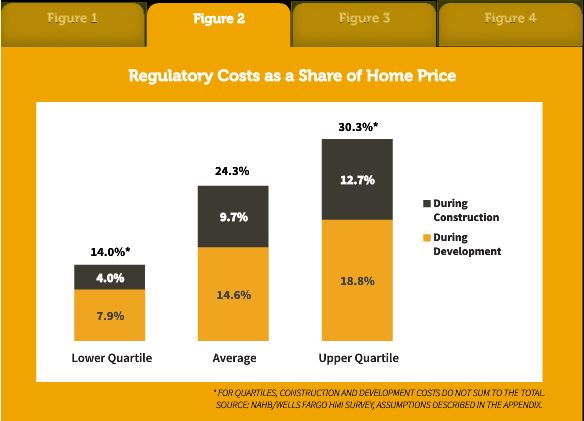
The above estimates are based largely on questions on the March 2016 HMI survey combined with other data on construction lags, interest rates, and profit margins (see the full study for details).
Regulation can be imposed by all levels of government—federal, state, and local. Sometimes it can be difficult to tease out which one is responsible. The Constitution generally leaves land use decisions to states, and states usually delegate zoning/permitting authority to local jurisdictions. Local governments also adopt and enforce building codes. However, the federal government is becoming more involved.
For example, under the 1987 expansion of the Clean Water Act, most construction sites require a permit for stormwater runoff. Stormwater permits are issued by the Environmental Protection Agency (EPA), or (more often) by states under programs authorized and monitored by EPA. EPA, the Federal Emergency Management Agency and the Department of Energy (DOE) also propose and lobby for changes in the model International Residential Code that is adopted in one form or another by jurisdictions in most states. DOE even has a budget to help persuade states to adopt more recent and stringent codes.
In 2011, NAHB published similar estimates, showing that regulation on average accounted for exactly a quarter of a new home’s price at that time. However, the average price of new homes sold increased substantially since then (from $260,800 to $348,900). Taking this into account, NAHB’s studies imply that average regulatory costs in a new home built for sale went from $65,224 to $84,671—a 29.8 percent increase during the roughly five-year span between estimates (Figure 3).
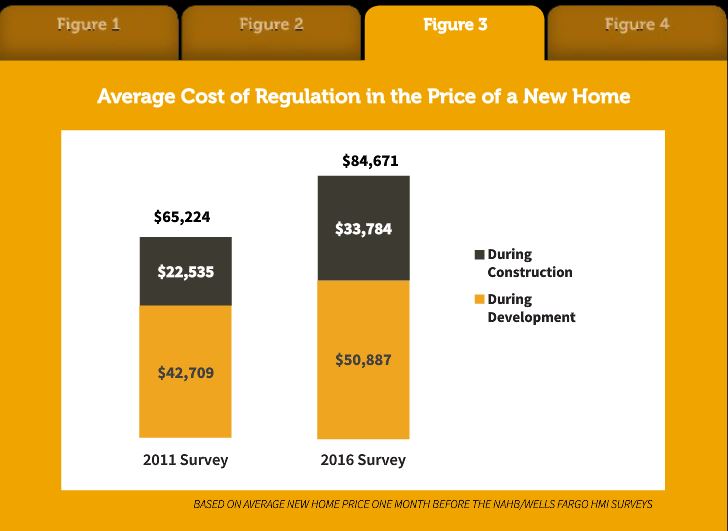
In comparison, the Consumer Price Index increased by only 6.1 percent during that time; so regulatory costs embodied in the price of an average new home greatly outpaced general inflation. Also during that span, disposable income per capita increased by 14.4 percent; so the cost of regulation in the price of a new home is rising more than twice as fast as the average American’s ability to pay for it.
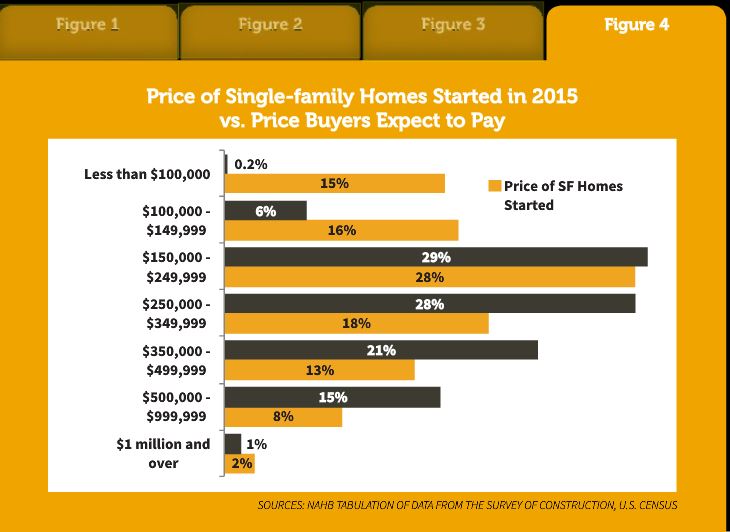
This has made it difficult to impossible to build homes for a significant part of the U.S. housing market. NAHB’s tabulation of the Survey of Construction data shows that roughly 78 percent of the new homes built for sale and started in 2015 were priced between $150,000 and $500,000. Fewer than 6 percent were priced under $150,000, and a vanishingly small share were under $100,000.
In contrast, NAHB’s 2015 Home Buyer Preferences Survey showed that 31 percent of home buyers want to pay less than $150,000 for a home, and 15 percent even want to pay under $100,000 (Figure 4). Given the discussion above, a fairly obvious explanation for the supply-demand mismatch is that regulatory and other costs often make it impossible to produce a new home for substantially less than $150,000.
The purpose of NAHB’s research is not to argue that all regulation is bad, but to show how much already exists, and to raise questions about whether regulators sufficiently consider costs when they propose new policies. Builders and developers may find it helpful to share these numbers with policymakers, or to media outlets, to help them explain the challenges and barriers to providing more affordable housing.
Original article, written by Paul Emrath, was published in the Fall 2016 Issue of Best in American Living.