Based on new surveying conducted by NAHB and Better Homes and Gardens, we can take a close look at the changing dynamics of home buyer demand including design preferences, features, and technologies preferred by new home buyers.
Against our expectations, the average size of new homes built in 2015 actually increased. Preliminary data for 2015 has the average size at 2,721 sq. ft. About this time last year we expected the average new home square footage would decline in 2015, given 1) that the average size was flat from 2013 to 2014 at about 2,660 sq. ft. and 2) new measures introduced in early 2015 to loosen mortgage credit gave us reason to believe a big wave of first-time home buyers would come in to the market and demand smaller homes. That hasn’t happened yet.

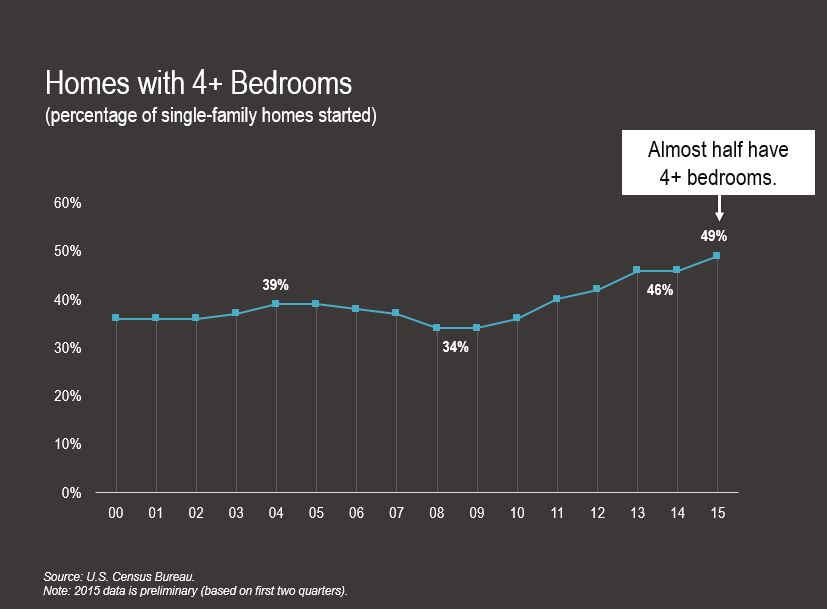
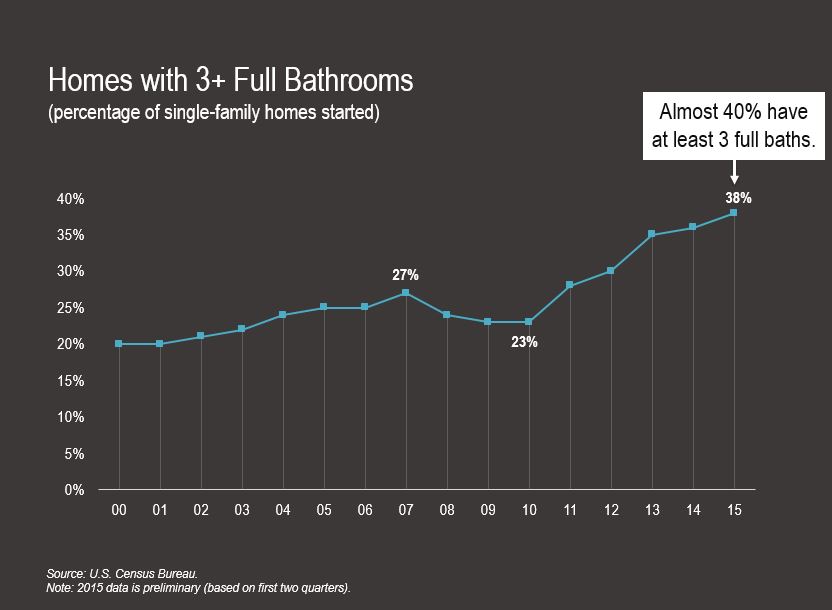
Just about half of all homes started in 2015 had at least 4 bedrooms. That share had been flat at 46% from ‘13 to ’14, but then picked up again in ‘15. Additionally, 38% of homes started in 2015 had at least 3 full bathrooms. This share has been trending up steadily for 5 years. In fact, it jumped 15 percentage points between 2010 and 2015, from 23% to 38%.

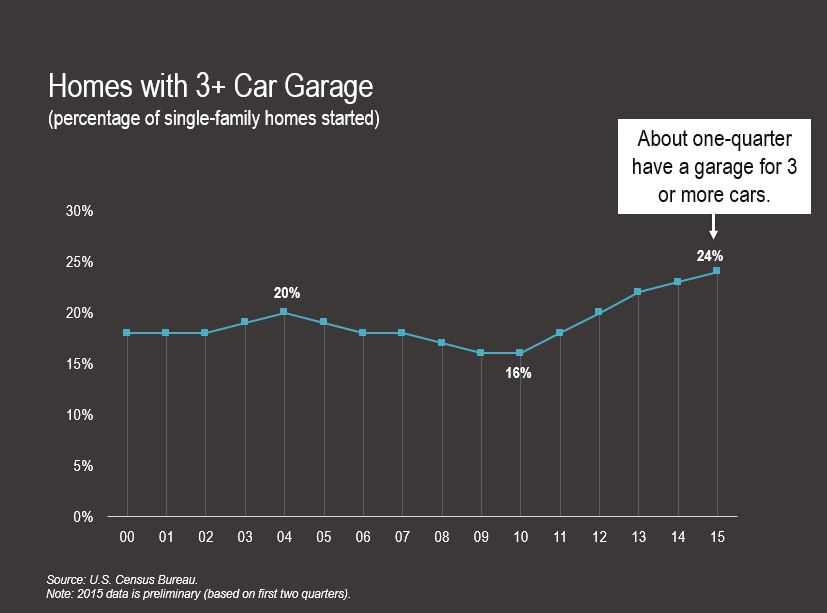
Another characteristic that has become more popular in the past five years is homes with garages for 3 or more cars. In 2015, that share was 24%, up from 16% five years earlier.

So, why do homes continue to get bigger and more expensive? It has a lot to do with first-time buyers remaining on the fence despite measures introduced in early 2015 to loosen credit tightness. Fannie Mae introduced loans with 3% down-payment and FHA reduced mortgage insurance premiums early last year.
How do we know first-timers and young adults haven’t flocked to homeownership? The first-time buyer’s share of existing home sales did not change very much in 2015, compared to recent years. It stayed at roughly 30%, about 10 points below the 40% seen during normal periods.
Consider the share of adults aged 25 to 34 living with parents. It was 10-12% for 25 years from 83 to 07, then it took off, reaching 15% in 2015. For pure hypothetical fun, if we instead had only 12% of young adults living at home in 2015, with 12% being the high end of the normal rate prior to 2008, that would mean only 5.2 million would be at home, and the difference – 1.3 million – would be on their own, in their own households. That’s a lot of housing units not being demanded.

